NatureQuest at Fernbank Celebrates Nine Years of Exploration

The Fernbank Museum in Atlanta, Georgia, has long been a favorite of our cultural attraction projects that we’ve completed. This year, NatureQuest at Fernbank is celebrating nine years since opening and inspiring kids, families, and caregivers in the greater Atlanta area to learn more about the diversity of nature that surrounds them. Within an 8,000 square foot exhibit space, NatureQuest seeks to engage all senses to immerse every guest with interactive, local environments and activities.  The scenery, lighting, and interactive elements are designed to be mindful and inclusive while creating a sense of wonder and discovery, and many of the exhibits can be easily rotated with additional content to keep the exhibit current and fresh.

NatureQuest Starfish

When creating NatureQuest, our design intent was to not make the environment a static, observational area. Children are naturally inclined to be scientists – their innate curiosity and drive to ask questions, try something, and see what happens is really the scientific method in practice. They learn by doing and getting involved with their surroundings. So what better way to ‘get on their level’, than by designing environments that encourage them to explore? For instance, the underwater area of NatureQuest allows kids and parents to pick up a starfish and match it to its home on a pier column, or they can crawl through a burrow in another nearby exhibit.  Throughout the space, we intentionally created environments that are meant to be explored, touched, and interacted with in a variety of ways, in the hope that both children and adults will learn more about the habitats right there in Georgia. 

NatureQuest Nightvision Interactive

NatureQuest isn’t just tactile — it’s tech-driven, too. The design seamlessly integrates entertainment technology into a highly educational and interactive environment with more than 50 interactive elements.  An example of this is the augmented reality binoculars placed near the cabin exhibit. Guests can peer through the lenses, and wherever they’re aiming the point of view, a pop-up video appears within the viewscreen to provide insightful information about what they’re looking at. The scientific content is artfully embedded into various aspects of the exhibit such that the interactions with elements are very intuitive and interesting for audiences.  Another example is the fish in the ‘digital’ river are regionally accurate and dart away or swim up for a look as the children ‘wade’ through. NatureQuest rewards exploration. There are no right and wrong answers, just new discoveries to be made and questions to be asked. Every child, regardless of age, foreknowledge, or ability, can succeed in this richly engaging, supportive experience. 

We’re quite proud of the work done at NatureQuest to bring this award-winning project to life. It has become a great addition to the Fernbank Museum, and the exhibit continues to serve the purpose of educating young children and their families of the areas surrounding Atlanta by engaging them with nature itself.

The Making of The Richard Nixon Presidential Library & Museum

How to tell the story of one of the most contentious American figures of the 20th century? 

From the native habitats of Georgia to the dystopian wilds of The Hunger Games, Thinkwell’s exhibit designs have gone to many vibrant places and told some amazing and unexpected stories over the years. But we were offered a new—and deeply relevant— arena to explore in 2013 when the Richard Nixon Foundation came to us with a challenge: to redesign the permanent exhibits at the Richard Nixon Presidential Library and Museum, which opened its new doors in October 2016. This task offered rich and exciting possibilities, but also posed these vital questions.

Even from the very start there was one thing we knew for sure: there wouldn’t be any hiding from the tough parts of the story. We needed to blow up the expectation that controversial topics like Watergate would be swept under the rug. Instead, we needed to bring them up at the very start, allowing the audience to see that this exhibit was aiming for a level of openness that can be difficult to achieve in many spaces—let alone a presidential library. The award-winning orientation film that guests can watch before entering the exhibits begins with Watergate and with Richard Nixon’s televised announcement that he will resign the presidency.

The next big hurdle Thinkwell faced was where to begin our story inside the exhibits. Richard Nixon was born in 1913, into an America that can feel almost unimaginably distant for the younger age demographic that the museum was hoping to attract. We wanted to start in a moment of action, a moment that would energize and connect with guests. Inspired by the dramatic tradition of in medias res, our exhibit begins in the middle of the story: amidst the turbulence and tumult and change of the 1960s, in a country that is deeply polarized and divided, when Richard Nixon is elected president in 1968.

With the starting point decided, the rest of the exhibit’s structure began to fall into place. We wanted to combine immersive spaces, powerful scenic vignettes, and bold and striking graphic imagery to shape spaces that felt alive and carried guests from moment to moment along their journey. Following Nixon’s first election, guests get to step into a fully explorable recreation of his Oval Office and then move into a series of galleries focused on the major issues, events, and ideas of Nixon’s presidency. These begin with a space dedicated to the war in Vietnam where a life-sized, gray scale vignette shows a pair of soldiers moving through the grass on the battlefield, juxtaposed against a graphic backdrop of photos of the protests at home on the wall beyond. In another standalone gallery that captures the scope and scale of Nixon’s world-changing trip to China, a pair of statues capture Nixon and Chinese Premier Zhou Enlai in the moment of their historic handshake, set against a large-scale graphic and scenic backdrop of Air Force One at the Chinese airfield. A frozen moment in time from a celebratory balloon drop scored with the catchy election anthem of “Nixon Now” provides the environment for another exhibit on Nixon’s landslide reelection victory in 1972, a sharp contrast to the Watergate exhibit that immediately follows.

It was here that the combination of the topic and the space provided a unique opportunity for Thinkwell to change the way we traditionally experience stories in museums. We decided to give our exhibit a flash-back—the first one to ever be used in a museum exhibit, as far as we know. Having reached Watergate and Nixon’s resignation, the exhibit narrative was in a place that called for reflection—how did Nixon get here? At the same time, we had a location at the far end of our exhibit space where windows overlooked the little house where Nixon had been born. With a little media and design magic, guests are able to transition back in time, following the Nixons as they flew back to California after the resignation and arriving in California not in 1974, but in 1913. A more subtle transition occurs here as well, shifting the perspective that the exhibit is following from the impersonal and external viewpoint of the outside world to a more personal, inward-looking sequence. This flashback concludes with an immersive and theatrical- ized version of the Lincoln Sitting Room, where guests are brought back to the “present” moment immediately following Nixon’s resignation.

Redesigning the permanent exhibits at the Richard Nixon Presidential Library gave Thinkwell an incredible opportunity to be a part of capturing a fascinating and important piece of history. More than that, it asked us to think in new ways about the stories we tell ourselves every day — stories about politics, about citizenship, about democracy, about America. In a time in which our political landscape has become turbulent and challenging, in which mass protests once again fill the streets of cities across the nation, taking on the story of Richard Nixon and his approach to the challenges of his time never did bring us all of the answers to the questions we started with. But it helped us begin to shape some of the questions that we will need to consider as we look to the future.

White Paper | Intellectual Properties and the Branded Experience

Thinkwell’s 2015 Guest Experience Trend Report Focuses on Consumer Trends in Location-Based Entertainment Infused with Intellectual Properties
The recent surge in popularity of intellectual properties (IP) appearing in everything from theme parks and attractions to merchandise and museums had us at Thinkwell wondering whether this phenomenon will be an enduring profit generator for IP owners and the operators of entertainment and education venues. Does the presence of an IP lend credibility, trustworthiness, and value to a venue and would consumers be willing to visit this venue more often? Especially as more location-based entertainment (LBE) venues start to incorporate IPs, would visitors spend more money and time on their experiences and should IP owners start to license their properties more heavily to explore that possibility?
The 2015 Thinkwell Guest Experience Trend Report was created to answer questions like those. For the past two years, Thinkwell has published Guest Experience Trend Reports that investigated the behavior of guests as they explored theme parks and museums and how technology could be utilized to enhance or improve their visits. For the 2015 Guest Experience Trend Report, Thinkwell examined not only the behavior of guests as they navigated experiences, but also the reasoning behind deciding to go and make purchases at LBE venues.
Thinkwell had a nationwide survey conducted that polled over 1,000 adults with children to analyze their spending choices at family-friendly LBEs, specifically family entertainment centers, children’s museums, aquariums & zoos, and restaurants. The goal of the survey was to determine whether families would be inclined to visit one of those venues more often and spend more money on purchases if they were completely infused with a specific IP from a major motion picture, television show, video game, or book.
The results, while not entirely surprising, confirmed that families are indeed willing to spend more on an experience at an LBE if it featured a specific intellectual property. What was surprising however was that the results showed respondents would be less willing to spend an increased amount of money or time at an IP-specific educational experience versus an IP-specific entertainment experience.
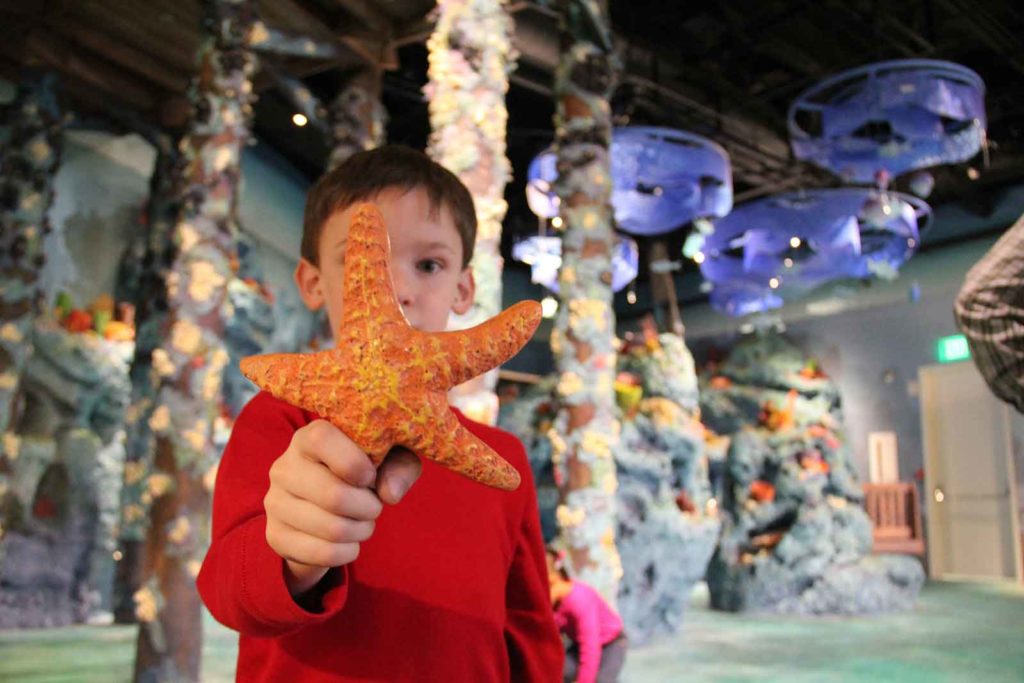
Most respondents still preferred authentic and traditional experiences at children’s museums and didn’t necessarily feel that adding an IP would increase the value of the educational experience. Even at zoos and aquariums, which toe the line between education and entertainment, a smaller percentage of respondents stated they would pay more for things like annual memberships, merchandise, and souvenirs at an IP-specific location. But when going out for fun at family entertainment centers however, a much larger segment of respondents stated that they would be willing to spend more money and time on an IP-specific experience.
Entertainment Versus Educational Experiences
An astonishing 76% of the survey respondents stated that they would enjoy the experience at a family entertainment center more if it were infused with a recognizable IP from a motion picture, television show, video game, cartoon, or book. More than 62% of respondents also said they would be willing to spend more money on food, souvenirs, and merchandise if they included characters or imagery from a favorite IP. Not only did respondents claim that they would be willing to spend more money at a family entertainment center if it was IP-specific, 72% also stated they would visit more often than if it was a generic LBE venue.


TW_TR2015_P4


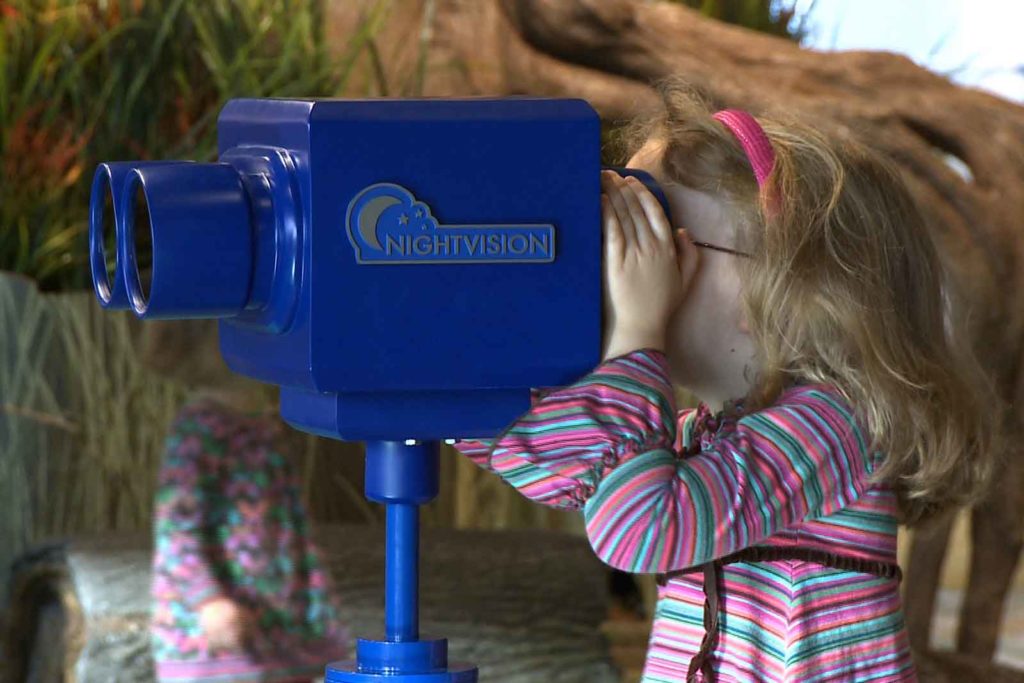
Though an impressive 61% of respondents also stated they would visit a children’s museum more often if there were exhibits based around a child’s favorite IP, only half of respondents stated they would be willing to pay more for an annual membership, merchandise, or souvenirs despite having IP-specific elements at the museum. In a more traditional educational institution, respondents did not feel that having IP-specific exhibits added any value or incentive to visit the venue more often, nor were they inclined to spend more money on purchases there.


Even at a zoo or aquarium, which blends education and entertainment, only little more than half of respondents stated they would want to visit more often if there were IP-specific exhibits. Because respondents claimed that the primary reason they visit a zoo or aquarium is to spend time together as a family and not to see new or existing exhibits, having IP-specific overlays would not be a compelling enough reason for visitors to visit more often or purchase more merchandise or souvenirs.


TW_TR2015_P5


While the previous three LBEs might be reserved for special occasions or weekend activities, 76% of respondents stated that eating out at a restaurant is a normal weekly activity. If an IP-themed restaurant was an option in addition to casual chain restaurants, fast food restaurants, and neighborhood restaurants, a majority of respondents stated that it would be a logical choice for their families when eating out. Particularly since a kid-friendly atmosphere was the most important factor for families in choosing a restaurant, having an IP-specific environment would please kids and parents alike, with Disney™, Star Wars™, and Harry Potter™ being popular IPs for influencing families on their themed restaurant choices.


TW_TR2015_P2


The Why and Why Not
The study conclusively revealed that respondents would indeed be willing to visit an IP-specific LBE venue more often and spend more money on these experiences. But what were the motivating factors for these preferences? Based on 1,032 open-ended answers, the respondents who were more likely to prefer an IP-specific LBE stated that the experiences would be “more fun,” “make the kids happy,” and “make the experience more special.” These respondents felt that seeing recognizable or familiar characters and elements would be a treat for the kids and would be far more entertaining that visiting a generic LBE.
For the respondents that did not feel more inclined to visit an IP-specific LBE, cost was the biggest deciding factor against choosing these experiences over generic ones. These respondents did not feel that an IP-infused experience added any value for the implied increased cost, nor did they feel that the quality of the environment, food, merchandise, or souvenirs would be any better at an IP-specific LBE. Other consistent responses were that an IP would make the experience “too commercial,” “trendy,” and “distracting” so that families wouldn’t be able to fully enjoy their time at an IP-specific LBE.
The Value of Intellectual Properties
After examining the survey responses, the 2015 Thinkwell Guest Experience Trend Report concludes that IP owners can absolutely benefit from licensing and infusing their IPs into family entertainment centers, children’s museums, zoos & aquariums, and restaurants. Respondents were generally positive about wanting to experience IP-specific LBEs and were willing to pay more money and spend more time at these venues. So to answer our initial question about whether extending an IP could be an enduring profit generator, the study confirms that there is a demand for it and IP owners should invest in meeting that demand.
“Thinkwell has believed in the power of an intellectual property in attracting and retaining guests since the very beginning of the company,” said Craig Hanna, Thinkwell’s Chief Creative Officer. “This study highlights that the value of blockbuster brands and IP is only getting stronger, even in an increasingly crowded market, and that the public’s thirst for IP hasn’t been quenched yet.”


VIEW THE ACCOMPANYING INFOGRAPHIC HERE.

Museums & the Digital Revolution: Consumer Trends in Mobile and Interactive Technology Integration in Museums

As museums and the visitors they attract are evolving, is this a space looking for increased digital and mobile interactivity?
Last year, Thinkwell released the company’s first Guest Experience Trend Report revealing the growing trends among Theme Park guests and their use of technology when they visit Theme Parks. Surprisingly, the results revealed that younger guests were much less concerned with mobile integration and that families and older guests primarily have an appetite for consumer-oriented mobile integration in theme parks.
This report inevitably led Thinkwell to think about this topic in relation to the company’s other specialized fields. We asked ourselves if we thought these results would carry across the various market segments in which we practice. With such high focus on technology and mobility in our lives today, are guests looking to integrate technology into their visitor experiences? Museums and the visitors they attract are evolving, so Thinkwell asked, is this a space looking for increased digital and mobile interactivity? The 2014 Trend Report honed in specifically on the current museum guest experience and visitors’ expectations and desires for such digital and mobile integration.
Thinkwell began a nationwide survey analyzing behavioral patterns in relation to guest experiences in museums. The survey reached over 1,400 museumgoers and found that 69 percent of the respondents bring mobile devices (tablets and/or smartphones) with them while visiting a museum. Of that 69 percent, a total of 73 percent used their device during their visit, most notably to take photos. Similar results were found in last year’s report on theme park mobile integration.
Though museums are using indoor GPS systems in conjunction with apps to push location-appropriate content to visitors, tailored to the exhibit they are in, Thinkwell is only seeing about 32 percent interest in such a feature. This result explains why over half of museum app users have uninstalled or not installed an app due to concerns about personal information, and 19 percent turn off the location tracking feature on their cell phones. Results show that this consumer market is not extremely eager for location-aware app advancements to enhance their in-museum experiences.
WHAT MUSEUM GUESTS LIKE
When asked to rank what they find to be the most beneficial features of museums, respondents chose as their top three: educational for me and/or my family, the ability to see real art and artifacts, and the content of the exhibits. Guests are visiting a variety of museums, from art to history to zoos and aquariums to get the personal satisfaction of bettering themselves and their families through education and learning.
The desire to see real art and artifacts contradicts a report from last year that suggested guests would be satisfied with highly accurate reproductions, as younger generations gravitate towards content and experiences, rather than originals. Our findings show that across all age demographics, guests highly value access to the authentic artifacts and art pieces available at museums, citing it as the second most important aspect of museums.
In regard to features that could improve a visitor’s experience, 42 percent would like to see more interactivity incorporated, and 40 percent of respondents feel that the use of audio related to a topic or object would be beneficial. Interestingly, a small minority of respondents would like to see an increase of adult-only extended hours and events. The interactivity guests seek is not limited to those found in digital devices. Visitors are interested in social and personal interactions that break beyond the four walls of the museums, with activities such as: after-hours events, classes and presentations from artists and subject-matter experts for children and adults, and kids crafts. They are more interested in increased human interactivity than in digital integration such as mobile apps or 3D printed, touchable objects.
On average, visitors spend a total of three hours at museums per visit. Not only do respondents ages 18-44 spend more time per visit than those ages 45 and up, they are also more likely to visit museums more often. Forty-four percent of respondents ages 18-44 visited museums 5 times or more during the past two years, while only 32 percent of those ages 45 and up did so.
white-paper-graphic-elements-02
WHAT MUSEUM GUESTS DO NOT LIKE
While Thinkwell had many findings in the annual Guest Experience Trend Report pointing to the positive qualities of museums, we also found that over 57 percent of visitors are highly concerned with cost of entry for museums today.
Other negative factors affecting museum visits included overcrowding and outdated content. Respondents felt strongly about having newer exhibits and special events as encouraging factors of repeat visits. Overwhelmingly however, 88 percent of respondents ranked their last museum visit as quite enjoyable or better.
Some believe that digital integration in the museum space is necessary to expand the experience both virtually and in terms of new types of physical space to engage those accustomed to interacting with a screen. However, Thinkwell’s findings reveal that the museum space is one used to escape screens and the digital world. Guests are focusing more and more on the authenticity of the art and artifacts.
white-paper-graphic-elements-03
MOVING FORWARD
In an increasingly interconnected and digital world that gives easy access to infinite amounts of data and information, the value and role of museums has come into question. While it’s clear that museums need to adapt to shifts in technology, guests still look to them for authority and authenticity. Digital technologies can be helpful to museums in order to supplement their content, but visitors still crave social interactions, personal enrichment and access to original, authentic objects. Custom experiences can be tailored to the individual, but guests still want those experiences to take place in a physical space with real live experts there to teach them and answer questions.
“We believe the best way to engage visitors in an experience is to have them participate in stories they can relate to and that are authentic and compelling,” said Craig Hanna, Chief Creative Officer of Thinkwell Group. “Museums are competing not only for time but also attention. Consumers can get content from their mobile devices. Museums need to do what they do best—present authentic content in a meaningful way that connects with their core constituencies—while also incorporating digital technologies to keep those experiences fresh and up to date with consumer expectations.”
“The results of the survey are fascinating and, for museums, heartening. Real stuff, real stories, real human experiences: it’s what museums do best, and it’s what visitors crave,” said Cynthia Sharpe, Senior Director of Cultural Attractions and Research for Thinkwell Group. “In conjunction with the fantastic research done by Jay Greene’s group at the University of Arkansas at the Crystal Bridges Museum of American Art regarding the value of field trips and the importance of facilitation, it bolsters the approach of using personal digital technology as a tool in the storytelling and educational arsenal. The educational and emotional impact of seeing real artifacts and experiencing great interpretation is paramount.”
Survey Respondent Demographics
white-paper-graphic-elements-04
Qualifying participants were United States residents over the age of 18 who had visited a museum/exhibit in the past 24 months. Of the 1,407 respondents, 42 percent were male and 58 percent were female. Nineteen percent were between the ages of 18-29; 26 percent between the ages of 30-44; 28 percent between the ages of 45-60; and 27 percent are 60 and above. Household incomes ranged between $25,000 and over $150,000. Less than 1 percent held less that a high school degree, 6 percent held only a high school degree, 29 percent had some college or an Associate degree, 40 percent had a Bachelor’s degree, and 27 percent had a Graduate degree. The survey found very little correlation, if any, between gender or location and current mobile behavior or interest in increased mobile integration for museums experiences.
Thinkwell is available for speaking engagements. Please contact us for more information.
View the White Paper accompanying this infographic here.

Infographic | Museums & the Digital Revolution: Consumer Trends in Mobile and Interactive Technology Integration in Museums

Thinkwell’s findings of their nationwide survey analyzing behavioral patterns as they relate to existing and potential mobile integration into the museums and exhibit experience is illustrated in the infographic below. This survey marks the second release of Thinkwell’s Guest Experience Trend Report, which provides market research insights to the themed entertainment industry. The annual report measures and distills consumer interests in varying topics related to guest experiences.
Thinkwell's 2014 Guest Experience Trend Report - Infographic
Read the White Paper accompanying this infographic here.